Units per capita steady since mid-1970s
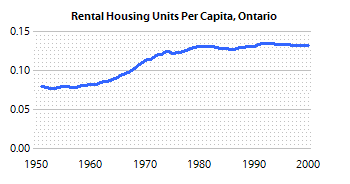
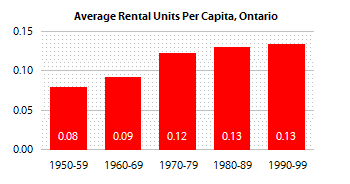
The following figures illustrate how the quantity of rental housing units and the population of Ontario have evolved, relative to one another, since 1950.
In a nutshell, the number of rental housing units per Ontarian rose by some 50% between the 1950s and 1970s - a result of the 1960s building boom discussed in an earlier post - but has barely budged since:


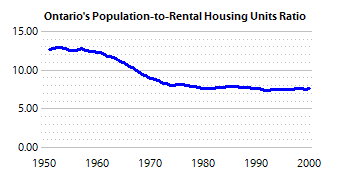
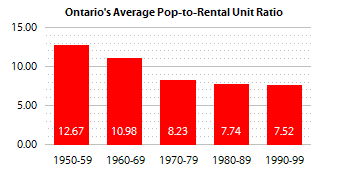
For redundancy's sake, here are the same statistics represented the other way 'round (pesons per unit, rather than units per person):


Source: CANSIM II Series V12 (using Q4 data for each year), V227532.


0 Comments:
Post a Comment
<< Home